Published On Mar 14, 2024
🆓 Try think-cell for free: https://tinyurl.com/xelplus
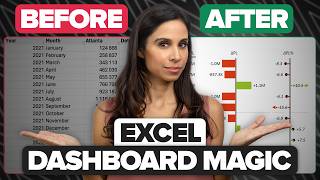
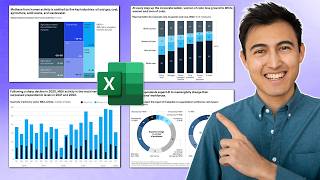
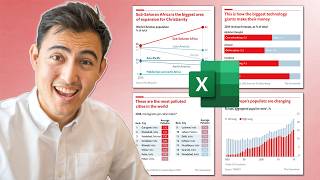
Want to make charts in Excel that look as good as the ones in The Economist magazine? This video shows you how. We cover three types of charts from The Economist: A special type of Bar Chart, Dumbbell Charts (also known as connected dot plot or before after chart), and Color-Coded Tables. These are professional Excel visuals you can add to your corporate presentation. You can also apply these Excel chart techniques to create other charts you come across from The Economist or elsewhere in news magazines or social media.
👉 Business Charts in Excel course is now available 👉 https://link.xelplus.com/yt-d-eco-biz....
⬇️ Download the free charts workbook: https://pages.xelplus.com/economist-c...
You'll learn how to set them up step by step, making your data presentation clear and engaging. This guide is perfect for beginners and anyone looking to improve their Excel skills. By the end of this tutorial, you'll be able to create eye-catching charts that can help in any report or presentation.
🔸 Easy-to-follow chart making in Excel
🔸 Create professional-looking charts like The Economist Magazine quickly
🔸 Tips for dynamic and clear data presentations in Excel
00:00 How to Make a Graph in Excel like The Economist Magazine
00:26 Bar Chart
04:32 Dumbbell Chart
11:07 Sponsor think-cell
12:45 Color-Coded Table
18:36 Outro
Join 400,000+ professionals in our courses here 👉 https://link.xelplus.com/yt-d-all-cou...
📨 Subscribe to "Between the Sheets" newsletter to stay on top of office tips and Excel hacks: https://link.xelplus.com/yt-d-newsletter
➡️ Join this channel to get access to perks:
/ @leilagharani
🎬 LINKS to related videos:
Excel Charts & Graphs: Learn the Basics for a Quick Start: • Excel Charts & Graphs: Learn the Basi...
Create Impressive Infographics in Excel: • Build Impressive Charts: It's NOT you...
👕☕ Get the Official XelPlus MERCH: https://xelplus.creator-spring.com/
🎓 Not sure which of my Excel courses fits best for you? Take the quiz: https://www.xelplus.com/course-quiz/
🎥 RESOURCES I recommend: https://www.xelplus.com/resources/
More resources on my Amazon page: https://www.amazon.com/shop/leilagharani
🚩Let’s connect on social:
Instagram: / lgharani
LinkedIn: / xelplus
This description contains affiliate links, which means at no additional cost to you, we will receive a small commission if you make a purchase using the links. This helps support the channel and allows us to continue to make videos like this. Thank you for your support!
Many thanks to think-cell for sponsoring this video.
#Excel #theeconomist