Published On Sep 14, 2020
Binance referral with %10 discount: https://www.binance.com/en/register?r...
Click to buy the best cryptocurrency wallet ever: https://shop.ledger.com/?r=060174241c06
The easiest way to buy cryptocurrencies with your credit card: https://cex.io/r/0/up110275514/0/
If you have any questions please leave a comment.
Also, please leave a comment about any video you want me to make.
THIS IS NOT INVESTMENT ADVICE. I am not a financial advisor, videos in this channel are just for educational purposes.
Hello friends! How are you and welcome to the Trading Journal channel? It is going to be our first video about candlestick charts. It is gonna be a short video, but it is useful for people who are new to Japanese candlestick charts. In the future, we will create more videos about candlestick patterns. Please subscribe us for more videos about trading and investing.
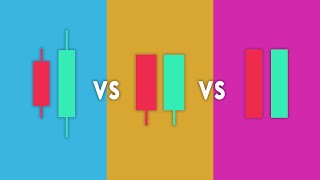
As you might have noticed there are many different chart types like line charts, bar charts, and our favorite candlestick charts. Most of the new traders use line chart because it is the most simple one and the easiest one to understand. But nearly all of the experienced traders stick to candlestick charts because after you learn how to read them, you can have much more information about the price just looking at candlesticks.
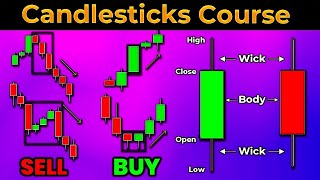
There are two types of candles in Japanese candlesticks. The bullish candle and the bearish one. Usually, the bullish candle is green or white and the bearish one is red or black but you can change the colors as you like. The color of the candles gives us information about the direction of the price. Green candles show us that the price is going up and the red candles show us that price is going down. Candles have specific parts which are tails and the body. Tails are also known as shadows or wicks. Let’s take a look at the parts of the candle:
Here you can see: Upper shadow is the line you see on top of the body
And, the body is the rectangle part in the middle
And, there is a lower shadow which is the line under the body.
It sounds so simple but these candlesticks are the best friends of a trader because even a simple candle gives us lots of information about the price. A professional trader can understand many things from these candles. I will show you what kind of information you can understand from candles but first, we have to decide our time frame.
While looking at the charts you can change the timeframe. We can look at daily or hourly charts and one candlestick equals to that timeframe. If you are looking at the daily charts, one candlestick equals to one day and if we are using 15 minutes charts, one candlestick equals 15 minutes. The timeframe we use depends on what kind of trader we are. If you are a day trader you should use short frame charts like 15 minutes or 5 minutes. If you are a swing trader you should use long frame charts like 1-hour or 4-hours.
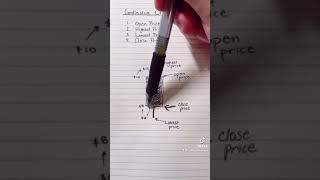
1 simple candlestick bar shows us 4 points:
Stocks opening price
Stocks closing price
The highest price of the time frame
The lowest price of the time frame
Now let’s look at the bullish candle to see these 4 points. You know that we can change timeframes of the charts, so if it is the daily chart, 1 candle equals 1 day. In green candles the lowest point of the body represents the opening price of the day. The top point of the body is our close price and it is a green candle because the closing price is higher than the opening price. And we have two shadows. The line below the body represents the lowest price of the day and the line above the body is the highest price of the day.
So let’s take a look at the candle’s journey. When we look at this candle alone we see that price opened here, moved up and down. It touched the lowest price of the day and went up again. Then it touched the highest price of the day and went down a little bit and the movement finished at the close price which is higher than the opening price.
Now let’s take a look at the bearish candle to understand what happens in bearish days. Red candles mean that the closing price of the day is lower than the opening price. So, the top of the body is the opening price of the day and the lowest point of the body is the closing price. As you can guess, the upper shadow represents the highest price of the day and the lower shadow is the lowest price of the day.
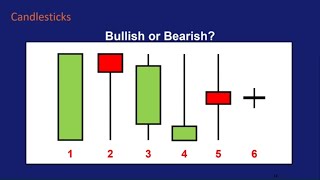
Now you know how to read candlesticks. Don’t forget that each candle represents a war between the bulls and bears. If it is a green candle it means that bulls win that round and if it is a red candle it means bears were the stronger group. In another video I will show you candlestick patterns and how to use them while trading. But in this video I will give you an example so that you understand them better.