Published On Streamed live on Mar 29, 2018
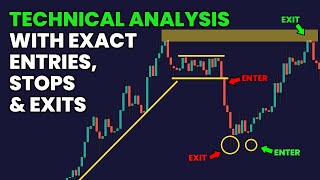
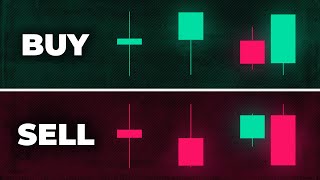
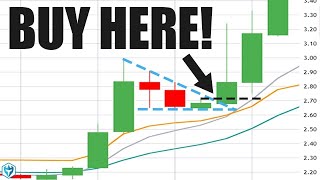
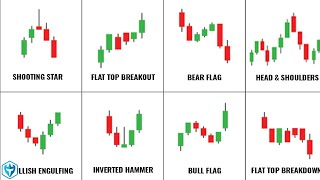
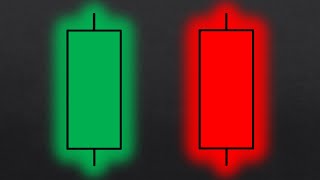
Online Trading Academy's Merlin Rothfeld reviews candlestick charts. Developed in the 18th century, Japanese Candlesticks were used to track the price of rice futures. They offered a glimpse of the battle between buyers and sellers and gave traders who used them a competitive advantage. Centuries later, Candlestick charts are a staple for technical analysis. In this webinar, we will look at a wide variety of candlestick formations and help you understand the psychology behind their structure and how they represent the continual struggle between bears and bulls in the marketplace.
Want to learn more about Online Trading Academy? Check out these playlists:
- Watch interviews with OTA Instructors: http://ota.buzz/2ubis14
- What is Online Trading Academy?: http://ota.buzz/2u1ed82
SUBSCRIBE to learn everything you need to know about trading: https://ota.buzz/2JRtxbd
SIGN UP for a FREE Half-day class! http://ota.buzz/youtube
LET'S CONNECT!
— / onlinetradingacademy
— / tradingacademy
— / online-trading-academy