Published On Oct 8, 2020
Simple moving average and exponential moving average are the 2 most-used moving averages that every trader should know. In this tutorial, I explained how to use them while trading.
If you have any questions, shoot them in the comments, I reply to everything.
Also, please leave a comment about any video you want me to make.
How to Trade Fibonacci Levels: • How to Trade Fibonacci Levels (MUST K...
10 Most-used Candlestick Patterns Explained in 5 minutes: • 10 Most-used Candlestick Patterns Exp...
Binance referral with %10 discount: https://www.binance.com/en/register?r...
Click to buy the best cryptocurrency wallet ever: https://shop.ledger.com/?r=060174241c06
The easiest way to buy cryptocurrencies with your credit card: https://cex.io/r/0/up110275514/0/
THIS IS NOT INVESTMENT ADVICE. I am not a financial advisor, videos in this channel are just for educational purposes.
Welcome to the Trading Journal. In this video, I will talk about the differences between the EMA and the SMA, later I will show you how to use moving averages to identify the trend. Please don’t forget to subscribe for more trading and investing videos.
Moving averages indicate trend direction. We have 2 main moving averages: The simple moving average, known as the SMA, and the exponential moving average, which is known as the EMA. Both of these averages can act as support or resistance. There are only small differences between the EMA and the SMA: Exponential moving average is a weighted moving average, which gives more weight to the recent prices, while the simple moving average gives equal weight to all the prices.
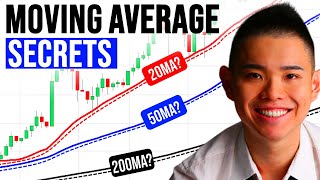
So, for example, lets say that we are looking at a 50-period simple moving average in a daily chart. This blue line we see is the average of stocks closing price for the last 50 days. So basically, our trading software takes the closing prices of the last 50 candlesticks and calculates the average of them.
Moving averages are important because of 2 main reasons. First, they indicate the direction of the trend, and second, they can act as support or resistance. Now, let’s look at the exponential moving average. This yellow line is the E.M.A.
As you can see, they look similar. But since the exponential moving average is calculated differently, it gives more weight to the recent prices. So it moves faster when the prices change. Here you can see that the price is going down, and as you can see, the yellow line here, moves down faster than the blue line. So, there is a gap between the two lines. The same thing happens also when the prices go up. The yellow line moves up faster than the blue line.
It is impossible to say that one is better than the other, because both of them have pros and cons. As I told you, the exponential moving average gives more weight to the recent prices, so, it is more sensitive to new data. For the short-term trades, it is better because it moves fast. But, since it uses weights, it tends to give more fake signals. So, we can say that even if E.M.A. reacts to price change faster, it is less stable. On the other hand, the simple moving average gives fewer fake signals, but it also moves way slower than the E.M.A. We can say that, it is more reliable for long-term traders.
Personally, I don’t have a favorite. I use both the EMA and SMA in different conditions. I switch between them depending on my timeframe and the strategy I use. I will always tell you which moving average I use in the future trading strategy videos. But, I usually use 20 and 40 period E.M.A. ’s and 50, 100 and 200 period S.M.A.’s usually depending on the situation. Scalpers use small time periods as low as 9 period E.M.A.
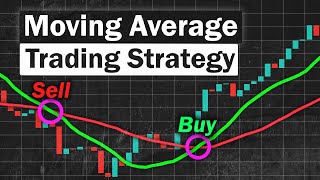
Slope of the moving average line indicates the direction of the trend. Here, you can that the moving averages have a positive slope and there is a bull run. However after that, the slope turns negative and the bearish trend starts. After that there is one more positive trend. This is how you use moving averages to identify the trend
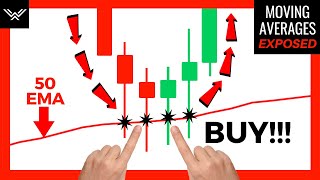
If the slope of the moving average is positive, and if the price is above the moving average, we can confirm that there is a positive trend. On the uptrends, moving averages can act as support, and on the downtrends, they tend to act as resistance. On our example on the screen, you can see that, the moving average acts as support many times on the uptrend. So prices go down, and they bounce off the moving average. We can see that, the moving average acts as a psychological barrier. We call that barrier, the support line. Since many traders look at moving averages, they go long on uptrends, when the price is near the average. These long trades push the prices back up again. Same thing happens in the down trends too.
Here you can see that there is a downtrend, and price goes down. But, while going down, it sometimes rises, and it bounces off from the moving average. In this situation , moving average acts as a resistance.