Published On Sep 28, 2020
Fibonacci Levels is one of the best tools which you can use while trading bitcoin, forex, and stocks. It is a great strategy both for day trading and swing trading. Make sure to subscribe for more trading strategies videos!
Binance referral with %10 discount: https://www.binance.com/en/register?r...
Click to buy the best cryptocurrency wallet ever: https://shop.ledger.com/?r=060174241c06
The easiest way to buy cryptocurrencies with your credit card: https://cex.io/r/0/up110275514/0/
If you have any questions please leave a comment.
Also, please leave a comment about any video you want me to make.
THIS IS NOT INVESTMENT ADVICE. I am not a financial advisor, videos in this channel are just for educational purposes.
Hello everyone, welcome to the Trading Journal channel. Today we have an important video about the Fibonacci Retracements. Cool name, right? Fibonacci is the technical analysis tool that I learned right after I started trading and from that day I found it really useful and used it many times. Fibonacci is used by many traders from beginners to pros. Today we will look at how we can use the Fibonacci tool while trading.
Before diving into how we trade the Fibonacci Retracements, let me give you a quick briefing about the Fibonacci numbers. Leonardo Fibonacci was the guy who lived nearly a thousand years ago and he came up with the numbers which he called the Fibonacci numbers.
Numbers go like you see: 0, 1, 1, 2, 3, 5, 8, 13, 21, 34, 55, and the list goes on.
I don’t know if you noticed some kind of a pattern between the numbers. Actually, there are a couple of patterns here. First of all, he gets a number and he adds the number to the preceding one. It starts with zero and after zero we got one. So it goes like this: 0 plus 1 is 1, and 1 plus 1 is 2, 2 plus 1 is 3, 3 plus 2 is 5, 5 plus 3 is 8 and the list goes like this. There is also one weird pattern between numbers. Each number is 1.618 times greater than the preceding number. And guess what we call this number? You might hear it before, this number 1.618 is called the Phi also known as the Golden Ratio. And this Golden Ratio appears in many places like nature and biology. Even in our body, there is a golden ratio between parts. So after a while, some genius or a weirdo asked if we can use these numbers in stock charts. You guessed right, the answer is yes and it is called the Fibonacci Retracement tool.
So now let’s come to the part we all want to learn. How we can use this Fibonacci tool while trading? Let’s open our favorite site, tradingview.com. Let’s look at the daily chart of Apple. Fibonacci is a tool we use in retracements, and in order to have retracements, we need a trend. Retracements are short-term price corrections during an overall upward or downward trend and these pullbacks give us great entry possibilities. Retracements usually happen because traders want to take their profits. Now let’s look at a trend to see these retracements. Hopefully, you can identify this trend by yourself. It is making higher highs and higher lows, so it is an upward trend.
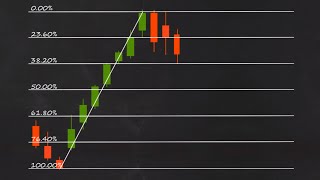
To use our Fibonacci tool, go the menu on the left and click here and on the menu we will select Fibonacci retracements. After we select our tool we will find the lowest swing point which is here and we will click here to start drawing our tool. Then we will find the highest swing point and click there to finish our drawing. You can slide the table to the left or right if it makes it easier for you to see. So, it looks cool right, we have many lines and colors and maybe you saw the numbers on the left side of the chart. There is a surprise for us because our golden ratio is here. It is 0.618 this time. This line with 0.382 and 0.5 are the most important lines of fibonacci tool. Actually 0.5 is not a Fibonacci number but still it acts the same as our two points.
Okay, let’s see what does these lines do. As you can see, there is a pullback in our trend and this pullback stops at a very special point which is 0.618. So these lines act as support during pullbacks. All of the 3 lines I marked can act as a support. To understand which one would act as one, we should always wait for the confirmation candle and we should never trade Fibonacci tool by itself. Instead, Fibonacci works fine when you use it with other indicators such as MACD or RSI.
The Fibonacci tool is really important because we always want to trade with the trend. We should never trade against the trend in order to make consistent profits. During trends, pullbacks are the best places to enter a trade and these Fibonacci points show us possible support points which we can enter. But to enter a trend we should check other indicators to see if it is a good point to enter. After checking the indicators I will open a position here, if the confirmation candle is green.