Published On Oct 3, 2020
How to read Japanese candlesticks: • How to Read Japanese Candlestick Char...
How to Trade Fibonacci Levels: • How to Trade Fibonacci Levels (MUST K...
Binance referral with %10 discount: https://www.binance.com/en/register?r...
Click to buy the best cryptocurrency wallet ever: https://shop.ledger.com/?r=060174241c06
The easiest way to buy cryptocurrencies with your credit card: https://cex.io/r/0/up110275514/0/
If you have any questions please leave a comment.
Also, please leave a comment about any video you want me to make.
THIS IS NOT INVESTMENT ADVICE. I am not a financial advisor, videos in this channel are just for educational purposes.
Welcome to the Trading Journal channel. Today we have a short video about the most used candlestick patterns. Let’s keep it short as promised and dive in. Please hit the like button if you find it useful.
If you don’t know how to read candlesticks you should watch our video about candlesticks first.
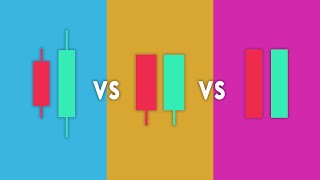
The first pattern we will see is pin bar candles. There two pin bar candles: the bullish one and the bearish one. They are called pincers because they look like a pin.
The bullish pin bar is a candle that appears at the bottom of downtrends, or at the support levels of uptrends. Color does not really matter, it can be red or it can be green. It has a small body that looks like a pin. The lower shadow is relatively long and it is at least 2/3 of the range of the candle. There is little or no upper shadow. It tells that bulls are getting control of the movement. So, there is a high probability that the price will go up.
The bearish pin bar is opposite of the bullish pin bar. It appears at the resistance levels of downtrends, or at the top of uptrends. Again, it can be red or green. It has a long upper shadow and a small or no lower shadow. It indicates that bears are getting stronger and there is a high probability that the price will go down.
Okay so moving from pin bars, we are gonna look at one white soldier and one black crow. Let’s start with the one white soldier.
The one white soldier appears at the bottom of downtrends, or at the support levels of uptrends. It consists of 2 candlesticks that begin with a bearish candle and followed by a bullish one. There are 2 rules: The bullish candle must open above the close of the bearish candle and make a higher low. Also, the bullish candle must close above the high of the bearish candle. There is a high chance that the price will go up.
The one black crow is the bearish version of the one white soldier. It appears at the resistance levels of downtrends, or at the top of uptrends. The bearish candle must open below the close of the bullish candle and make a lower high. Also, the bearish candle must close below the low of the bullish candle. It indicates that bears are getting stronger and there is a high chance that the price will go down.
Let’s move to the morning and evening star. Morning star appears at the bottom of downtrends, or at the support levels of uptrends. It consists of 3 candlesticks that begin with a bearish candle, followed by an indecision candle, followed by a bullish candle. The color of the indecision candle does not matter, it can also be a doji candle. There must be a price gap between the first candle and the second candle, also, between the second Candle and the third one. The third candle should close above half the body of the bearish candle. This pattern tells us that bulls are getting stronger.
The opposite version of the morning star is the evening star. Evening star appears at resistance levels of downtrends, or at the top of uptrends. It also has 3 candlesticks that begin with a bullish candle, followed by an indecision candle, followed by a bearish one. The second candle’s color does not matter, it can also be a doji candle. There must be a price gap between the first candle and the second one, also, between the second Candle and the third one. The third candle should close below half the body of the bullish candle. This pattern tells that bears are getting stronger and a reversal is most likely.
Up next there are engulfing patterns. Both the bullish and the bearish engulfing patterns consist of 2 candles. The bullish engulfing starts with a bearish candle followed by a bullish one. The bullish candle has a large body that totally engulfs the body of the bearish candle. The bullish engulfing appears at the support levels of uptrends, or at the bottom of downtrends. There is a high probability that the price will go up.
The bearish engulfing is the opposite of the bullish one. It starts with a bullish candle followed by a bearish one. The bearish candle's body engulfs the body of the bullish candle's. There is a high probability that the price will go down. #candlestickpatterns #tradingjournal #tradingtutorial