Published On Premiered Jan 5, 2024
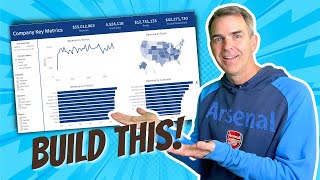
Tableau Business Intelligence Master Tutorial
Get Ad-Free Training by becoming a member today!
/ @learnittraining
Exercise Files: https://learnitanytime.com/p/exercise...
Who it's for: Anyone looking to apply Tableau tactics and tools to real-world business scenarios.
What it is: Tableau is a popular tool for analyzing and visualizing data, with powerful features like interactive dashboards, custom reports, and more.
What you'll learn: This course will take your Business Intelligence skills to the next level by teaching you Tableau best practices and showing you how to create insightful, sought-after dashboard designs. Get ready for an intense, but amusing journey that will provide you with an arsenal of innovative Tableau techniques. Your new toolset will help you create new worksheets, as well as repurpose the ones you already use, to share across interactive dashboards. Users will enjoy interacting with your dashboards for the purpose of getting deep analytical information from them and they will be impressed with their flexibility and visuals. Most importantly, this course will go over a variety of business scenarios that translate into different types of dashboards and workflows. By the end of the course, you will be able to create effective dashboards on your own and you’ll also walk away with class files to help you get a head start on your Business Intelligence journey.
Join Learnit Anytime for ad-free training, exams, certificates, and exclusive content:
https://www.learnitanytime.com
For Private Group Trainings please visit:
https://www.learnit.com/private-group...
Manuals: https://bit.ly/30xZb59
Username: manuals
Password: password
Start 0:00
Introduction 0:09
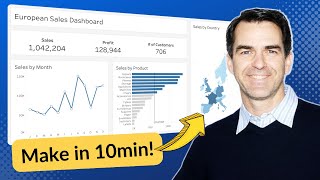
Regional Data Dashboard 2:18
Hovering Actions 2:54
Building the First Map 6:18
Starting the Second Map 9:02
Modifying the Second Map 12:01
Creating Two Dashboards 13:25
Creating and Testing Dashboard Filter Actions 16:29
Creating Reset Filter Dashboard Actions 20:27
Granularity and Using LOD Expressions to Exclude Detail 24:19
More Granularity with Un-Aggregated Measures in View 31:22
Creating Calculated Fields Using Various Functions 34:46
Building Maps Showing Specific Metrics 50:35
Building Scatter Plots with Reference and Trend Lines 59:16
Formatting Scatter Plots and Making Titles Dynamic 1:04:11
Modifying Tooltips and Creating Dashboards 1:06:37
COUNT-COUNTD-STDEV-STDEVP 1:08:58
Count vs Count Distinct and Showing Difference 1:11:39
Creating Ratios Between Types of Metrics 1:14:24
Using Standard Deviation 1:20:19
Conclusion 1:27:16
#tableau #tableaututorial #tableauclasses #businessintelligence
(C) 2023 Learnit, Inc.
Any illegal reproduction of this content will result in immediate legal action.