Published On Mar 20, 2024
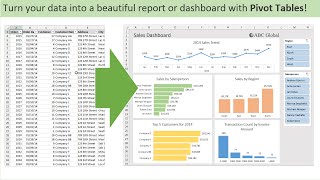
Unlock the Secret to Creating Dynamic Charts in Excel!
Ever found yourself stuck with charts cluttered by zeros or blank spaces? Look no further! In this step-by-step tutorial, I'll walk you through the process of creating dynamic charts in Excel that automatically exclude zeros and blank values for a cleaner, more professional look.
We'll dive into:
Creating Two Helper Columns to filter and manage your data efficiently.
Crafting Two Named Formulas that bring your dynamic charts to life.
Here's a sneak peek at what we'll cover:
Helper Column Magic:
For Non-Blank, Non-Zero Values: =FILTER(H:H,(I:I not equal " ")*(I:I not equal 0))
Error-Free Lookup: =IFERROR(VLOOKUP(N2,H:I,2,FALSE),"")
Dynamic Named Formulas:
Dynamic Range for Your Chart: =OFFSET('Dynamic Chart'!$N$2,0,0,COUNTA('Dynamic Chart'!$N:$N)-1)
Dynamic Commissions Filtered: =OFFSET('Dynamic Chart'!$O$2,0,0, COUNTIF('Dynamic Chart'!$O:$O,"greater than 0"))
Why is this important?
Dynamic charts not only elevate the aesthetic of your presentations but also ensure that your data is presented in the most effective way possible. By excluding zero and blank values, your charts become more focused, easier to interpret, and infinitely more engaging.
Whether you're preparing for a business presentation, a school project, or just love honing your Excel skills, this video is tailored for you.
Don't let cluttered charts hold you back. Let's dive in and transform your data visualization skills!
👨💻 LET ME BE YOUR MENTOR: https://topmate.io/mehran_vahedi
📸 SOCIAL : Connect with me on X and LinkedIn :
X : @WisdomByData
LinkedIn : / mehranvahedi
🔗 Check out my Skillsoft Courses :
https://linktr.ee/MySkillsoftCourses
#ExcelTips #DynamicCharts #DataVisualization