Published On Premiered Sep 1, 2023
Tableau Data Visualization Intermediate Tutorial
Get Ad-Free Training by becoming a member today!
/ @learnittraining
Exercise Files: https://learnitanytime.com/p/exercise...
Who it's for: Anyone looking to get the most out of Tableau's unmatched data visualization tools.
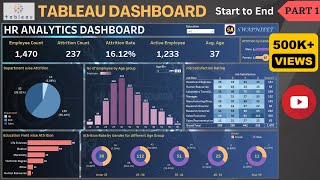
What it is: Tableau is a popular tool for analyzing and visualizing data, with powerful tools like interactive dashboards, custom reports, and more.
What you'll learn: In this 6-part series, we start with the basics, showing you some best practices for connecting data sources and creating univariate, bivariate, and multivariate charts. Then, we jump into working with maps and groups. Next, we explore calculating user-defined fields, as well as customizing, saving, and exporting. We take some time to go over summarizing and interacting with data and then end with a sizable series of tips and tricks on dashboards, visuals, and sharing your creations with the world.
Join Learnit Anytime for ad-free training, exams, certificates, and exclusive content:
https://www.learnitanytime.com
For Private Group Trainings please visit:
https://www.learnit.com/private-group...
Manuals: https://bit.ly/30xZb59
Username: manuals
Password: password
Start 0:00
Introduction 0:09
Bivariate Charts 1:39
Creating Tables 2:57
Creating Scatter Plots 5:47
Swapping Rows and Columns 8:19
Adding Trend Lines 10:40
Modifying Trend Lines 14:19
Selecting Color Palettes 15:19
Using Dates 18:10
Bivariate Charts Recap 21:16
Multivariate Charts 22:31
Creating Facets 24:30
Creating Area Charts 28:55
Creating Bullet Graphs 32:48
Creating Dual Axis Charts 37:06
Creating Gantt Charts 39:55
Creating Heat Maps 49:29
Axis and Title Formatting 54:01
Multivariate Charts Recap 55:15
Maps 58:11
Setting Geographic Roles 59:21
Placing Marks on Maps 1:00:28
Choosing Mark Size and Color 1:02:56
Modifying Marks 1:05:06
Overlaying Demographic Data 1:06:59
Adding Data Layers and Changing Map Styles 1:10:02
Excluding Unknown Values from Maps 1:13:08
Creating Choropleth Maps Using Show Me 1:16:28
Creating Choropleth Maps with Modifications 1:18:31
Polygon Shapes 1:24:27
Creating Groups 1:30:03
Switching Shapes and Using Groups to Define Maps 1:30:46
Customizing Maps 1:34:18
Maps Recap 1:36:11
Conclusion 1:39:45
#tableau #tableaututorial #tableauclasses
(C) 2023 Learnit, Inc.
Any illegal reproduction of this content will result in immediate legal action.