Published On Premiered Dec 1, 2023
Tableau Business Intelligence Beginner Tutorial
Get Ad-Free Training by becoming a member today!
/ @learnittraining
Exercise Files: https://learnitanytime.com/p/exercise...
Who it's for: Anyone looking to apply Tableau tactics and tools to real-world business scenarios.
What it is: Tableau is a popular tool for analyzing and visualizing data, with powerful features like interactive dashboards, custom reports, and more.
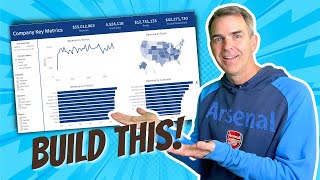
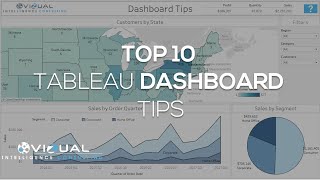
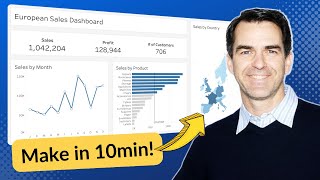
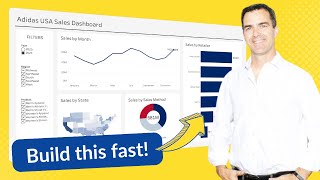
What you'll learn: This course will take your Business Intelligence skills to the next level by teaching you Tableau best practices and showing you how to create insightful, sought-after dashboard designs. Get ready for an intense, but amusing journey that will provide you with an arsenal of innovative Tableau techniques. Your new toolset will help you create new worksheets, as well as repurpose the ones you already use, to share across interactive dashboards. Users will enjoy interacting with your dashboards for the purpose of getting deep analytical information from them and they will be impressed with their flexibility and visuals. Most importantly, this course will go over a variety of business scenarios that translate into different types of dashboards and workflows. By the end of the course, you will be able to create effective dashboards on your own and you’ll also walk away with class files to help you get a head start on your Business Intelligence journey.
Join Learnit Anytime for ad-free training, exams, certificates, and exclusive content:
https://www.learnitanytime.com
For Private Group Trainings please visit:
https://www.learnit.com/private-group...
Manuals: https://bit.ly/30xZb59
Username: manuals
Password: password
Start 0:00
Introduction 0:09
Personal Finance Dashboard 2:40
Tableau Data Interpreter 3:34
Using the Data Interpreter and Reviewing Results 4:49
Viewing Hidden Fields, Adding Connection, Creating Relationship and Join 10:09
Creating Text Table Visaulizations 15:22
Formatting Text Tables 19:50
Creating Bullet Graphs 23:53
Creating Area Charts 26:50
Creating Highlight Tables 32:14
Creating Horizontal Bar Graphs 37:38
Copying Sheets 39:41
Modifying Visualizations 41:32
Applying Workbook Themes 42:28
Horizontal and Vertical Containers 44:28
Creating Dashboards without Containers 45:51
Creating Dashboards with Horizontal Containers 49:59
Exploring Captions on Dashboards 54:35
Creating Dashboards with Vertical and Horizontal Containers 56:09
Creating Dashboards with Floating Objects and Reviewing Item Hierarchy 1:01:29
Horizontal and Vertical Containers Recap 1:08:41
Superstore Basic Sales Dashboard 1:09:27
Mining Built-In Accelerator for Data Sources 1:09:50
Creating Performance Visualizations 1:16:33
Creating Calculated Fields that Return Text Values 1:20:51
Adhoc Calculations 1:25:51
Creating Forecast Visualizations 1:30:13
Creating What-If Visualizations 1:32:29
Creating and Adding Captions to Parameters 1:38:39
Creating Calc Fields Referencing Parameters 1:40:10
Adding Calc Fields to View and Test Parameters 1:45:32
Creating Executive Overview Visualizations 1:48:49
Creating Filled Map Visualizations 1:58:59
Creating Sales by Segment Visualizations with Custom Tooltips 2:02:51
Creating Sales by Category Visualizations by Copying and Updating 2:15:28
Creating Overview Dashboards 2:16:24
Using Visualizations as Filters for All Dashboard Visualizations 2:24:30
Creating Sales Forecasting Dashboards 2:29:50
Creating Sales Performance Dashboards 2:34:26
Adding Navigation Objects and Creating Dual Axis Visualizations 2:36:00
Superstore Basic Sales Dashboard Recap 2:48:04
Conclusion 2:48:56
#tableau #tableaututorial #tableauclasses #businessintelligence
(C) 2023 Learnit, Inc.
Any illegal reproduction of this content will result in immediate legal action.