Published On Premiered Sep 29, 2023
Tableau Data Visualization Professional Tutorial
Get Ad-Free Training by becoming a member today!
/ @learnittraining
Exercise Files: https://learnitanytime.com/p/exercise...
Who it's for: Anyone looking to get the most out of Tableau's unmatched data visualization tools.
What it is: Tableau is a popular tool for analyzing and visualizing data, with powerful tools like interactive dashboards, custom reports, and more.
What you'll learn: In this 6-part series, we start with the basics, showing you some best practices for connecting data sources and creating univariate, bivariate, and multivariate charts. Then, we jump into working with maps and groups. Next, we explore calculating user-defined fields, as well as customizing, saving, and exporting. We take some time to go over summarizing and interacting with data and then end with a sizable series of tips and tricks on dashboards, visuals, and sharing your creations with the world.
Join Learnit Anytime for ad-free training, exams, certificates, and exclusive content:
https://www.learnitanytime.com
For Private Group Trainings please visit:
https://www.learnit.com/private-group...
Manuals: https://bit.ly/30xZb59
Username: manuals
Password: password
Start 0:00
Introduction 0:09
Making Dashboards Relevant 2:16
String Manipulation in Dashboards 3:57
Concatenating Customer Fields 7:34
Concatenating Region and State Fields 9:41
Creating and Applying Calculated Fields to Sheets 11:59
Correcting Data Exports from Tableau to Excel 14:26
Introduction to Blending Data 19:53
Bringing in Sources and Editing Blend Relationships 21:29
Creating Text Tables from Sources and Excluding Incomplete Data 26:06
Optimizing Tips for Efficient Fast Visualizations 28:53
Adding Dashboard Actions for Companion Visualization Sheets 30:11
Adding Text Objects to Direct Users on Accessing Actions 32:29
Reviewing Dashboard Marks from the Status Bar 35:12
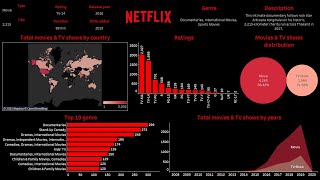
Introduction to Adding Infographics 36:03
Adding New Shapes 37:14
Copying Sheets and Changing Mark Colors for Different Regions 40:13
Creating Sheets for the Other Two Regions 41:20
Creating Line Charts for Regions and Explaining Data 42:13
Creating Charts Showing All Regions and Sales 47:50
Creating a Central Region Infographic 50:51
More Practice Adding Inforgraphics 58:39
Making Dashboards Relevant Recap 59:52
Visual Best Practices 1:03:36
Coloring Numbers 1:04:44
Dual Axis Dueling 1:06:46
Pie Charts or Not 1:07:39
Sizing to Make a Data Story 1:08:52
3D Data 1:11:03
Obtaining and Reviewing Excel Source Files 1:11:59
Creating Inner Joins on Tables Using Join Calculations 1:13:30
Determining MAX Profit Ratio 1:15:30
Starting on the New Visualization 1:19:01
Applying 3D Shapes to Sub-Categories 1:22:08
Increasing Column Size and Deleting Axis and Lines 1:25:19
Visual Best Practices Recap 1:29:42
Sharing Dashboards 1:30:35
Exporting Packaged Workbooks 1:30:59
Publishing to Tableau Public 1:33:00
Mobilizing Your Dashboards and Other Layout Options 1:38:22
Sharing Dashboards Recap 1:42:05
Conclusion 1:43:52
#tableau #tableaututorial #tableauclasses
(C) 2023 Learnit, Inc.
Any illegal reproduction of this content will result in immediate legal action.