Published On Jun 4, 2022
In this video, I will explain about the ADX indicator. I will also explain an ADX trading strategy, which may help you to achieve your target with more accuracy.
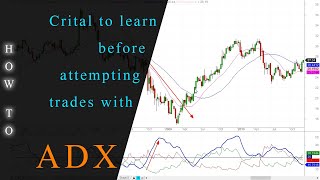
The meaning of the ADX is average directional index. It is a very helpful to identify the strength of the trend. it can show the strength of the bullish trend as well as the strength of the bearish trend.
ADX line is indicated by blue color. +DI line is indicated by the green color and -DI line is indicated by the red color. These all three lines have their own tasks. The ADX line will show only the strength of the trend. It oscillates between the 0 and 100 value. if the ADX value is between the 0 and 25 level then it will be a very weak trend and during this, the price of the stock will be in the sideway zone. we should not trade when the ADX is between the 0 and 25 level. As the value of the ADX increases from the 25 level, the trend becomes stronger. We will make our trade setup only when the ADX line goes above the 25 level. After reaching to the maximum level when the ADX line moves to downward direction then it will indicate that the strength of the trend is starting to become weak. When +DI line crossover the -DI line from downside to upside, it is called the bullish crossover and during this bullish crossover, we can get the buying signals. Similarly, when +DI line crossover the -DI line from upside to down side, it is called the bearish crossover and during this bearish crossover, we can get the sell signals.
In our strategy, we will also use the exponential moving average. We will discuss about the conditions for the trade setup. We will make our trade after our conditions will be satisfied.
#adxindicatorstrategy #adxandmovingaverage #tradingstrategy